math


Like many people, I looked at Nate Silver’s model for the presidential election outcome daily for the last six months. I hoped it would calm me down. It didn’t. I was not calm because his model was predicting somewhere between pretty close and extremely close the whole time, unlike during the 2012 election. Here’s what it looked like on election day–the blue line was the probability that Hillary Clinton would win and the red line was the probability that Donald Trump would win:

538-graph-election-day

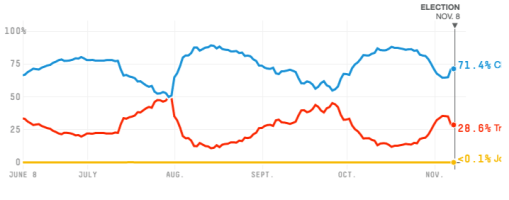
A lot of people seemed to have looked at this and decided that Trump had very little chance of winning. That’s not what it says at all, and I think this points to a problem with our math curricula.

We could and should but do not have any kind of grasp of probability by the time we graduate high school. We need the education, because our brains have trouble taking base rates adequately into account. (See the second blurb here for a little more information.) We spend a lot of time learning algebra, which is for a normal person useful only for internalizing arithmetic and for the general brain workout, but we spend almost no time learning about probability. So we have an electorate swung in part by those living in genuine fear of being killed in a terrorist attack, which is a near-zero percent probability, and by those who were blasé about Trump’s chances of winning.

Basic probability is not hard to learn. Any teenager of average intelligence and a week of Dungeons & Dragons under their belt could have told you that Trump could easily win the election. The worst his chances ever got were about the same as rolling a 1 on an 8-sided die. It’s not great odds, but you don’t bet the life of your character on it, much less the fate of your whole game. And that’s the worst it got. It looks like he averaged around the chance of rolling a 1 on a 4-sided die. That happens a lot. Give it a try.

I’d love to see algebra classes replaced entirely by statistics classes, but I’d settle for replacing the first two weeks of Algebra I with an intro to dice gambling. The idea that knowing how to factor polynomials is more important than a real grasp of probability is hurting us.

Many decades in the future, when human nutrition is finally a reputable science, our current tendency to think of foods in categories like “good for you” or “bad for you,” will seem quaint. We will probably find not only that all foods have both helpful properties and less helpful properties, but that those properties are enhanced, dampened, or reversed depending on many, many factors like quantity, preparation, combination, microbiome ecology, genetics, epigenetics, other physiological factors, environmental factors, psychological factors, and who knows what else. I don’t say this to insult people who spend their time thinking about nutrition and diet, but to point out a useful fact. When science tackles any very complex topic, the knowledge it turns up, even if it was basically correct, always seems quaint 100 years later. That goes double for folk wisdom and other less-rigorous forms of collecting knowledge.

That is the caveat to the following explanation of how I am currently thinking about chocolate:

To the extent that such a category exists, it is looking like chocolate may be “good for you.” I won’t go into how or why, as there are a zillion articles about that, all waiting to be proven wrong or quaint, but there is a strong chance that eating chocolate is largely helpful.

The problem is that chocolate tastes terrible by itself, so it is almost always sold in combination with sugar, a food that is very, very likely “bad for you.” Sugar has the power to make chocolate and many other foods taste great, but also the power to screw you up in a bunch of ways; the Satan of food, if you will.

What is your minimal sugar requirement to make chocolate tolerable? How about pleasurable? It’s easy and fun to figure out. (Although while I was figuring it out in a grocery with my friends, Abbi and Matt, a woman said, “You are ruining chocolate for me. Make a choice and get out.” Clearly this is not fun for everyone.) It just takes a grocery with a decent chocolate selection, a little math, and some chocolate money.

Chocolate selection at the Kiva, Eugene. Site of ruining chocolate for one woman.

Here are the “nutrition facts” for a 41-gram bar of Hershey’s Special Dark dark chocolate:

The math here is easy, since the “serving size” is the whole bar. Just over half of this chocolate bar is pure sugar. Imagine the bar below with the ingredients separated, the chocolate on the right, the sugar on the left:

Hershey Special Dark dark chocolate bar, sugar mixed in.

The six squares on the left would be pure sugar. That’s a lot of sugar.

The lowest-sugar bar at the Kiva was Lindt Excellence 90% Cocoa Supreme Dark bar, at 7.5% sugar. That’s like almost one of one of the squares above. I found it taste tolerable–enjoyable, even, but more in the way wine can be enjoyable than in the way I normally expect chocolate to be enjoyable. Interesting rather than incredibly delicious. I also found that I did not eat it nearly as compulsively as I do sweeter chocolate.

The runners-up were E. Guittard’s Nocturne “pure extra dark chocolate” 91% cacao, at 8.8% sugar and Theo’s Venezuela 91% Cacao, at 9.5% sugar; each had the equivalent of a little more than a square of sugar out of the bar above, about 10 and 20% more sugar than the Lindt. These bars were easier to eat–less burned and bitter tasting, but still definitely in the enjoyable-like-wine category, a little smoother and maybe fruity or aromatic.

The rest of even heavy-duty dark chocolate bars were at 20% or more sugar. That’s at least almost three squares in the bar above. Green & Black’s Dark 85%, for example, is exactly 20% sugar. I haven’t tried it recently, but after eating these 3-10% bars, I expect it to taste quite sweet, with more than twice as much sugar as the runners-up and almost seven times as much as the Lindt Excellence.

Sometimes the nutritional facts numbers do not add up. I noticed that with the Green & Black 85% bar. It’s got 8 grams of sugar per 40 gram “serving” in a 100 gram bar. That’s 20 grams of sugar per 100 gram bar, thus the 20% sugar I calculated. How is it, then, that the bar is also 85% cocoa? Chocolate companies, please explain your math.

This is my 14,179th day.

I was born on September 29, 1971. On my last birthday, I had been alive for 38 years, which is 13,880 days. (That’s 365 x 38 + 10 leap days.) Today is the 299th day of my 39th year, my 14,179th day.

I plan to live at least to my 100th birthday, if things remain pleasant enough. On that day, I’ll be 36,525 days old, so I’ve got at least 22,346 days to go. That sounds pretty good. I should be able to do a lot of good stuff in 22,346 days.

If you want to calculate your age in days but don’t want to do the math, here is a site that my friend David pointed me to, after I’d already sweated it out.

I was just on Skype with my friend Jonathan, who is also in a long-distance relationship. His is between Vancouver, BC and Germany. Mine is between Eugene, OR, and Vancouver, BC. We started coming up with a scheme for measuring the difficulty of a long distance relationship. Here are the major factors we came up with:

1) Financial impact of making the trip

2) Number of travel hours separating the couple

3) Amount of time difference between locations

To that I’m going to add,

4) The availability of high-quality video chat.

5) Number of days left before final reunification.

Obviously, any such attempt will result in a major oversimplification, but I’m thinking we should stick with easily measurable factors. For example, the communication ability of each partner plays a huge part in the success of a LDR, but is difficult to measure, so I’m leaving it out. If the couple prefers not to fly for ethical or other reasons, it will factor in, too, but I’m leaving that out as well. And so on.

So, how do we calculate this index? Generate numbers for each factor:

1) Cost of a round trip, divided by the combined income of couple.

2) Number of hours travel, round trip, by that mode of transportation.

3) Number of hours difference between locations, plus 1. So if you’re in the same time zone, you get a 1 here, and if you’re eight time zones off, you get a 9. The plus 1 is just to make a no-time-zone-difference a nonzero number, for calculating the index.

4) I’m going to estimate that having good video chat makes LDRs ten times easier, so if you have it, you get a 1 and if you don’t, you get a 10.

5) The number of days left before final reunification.

Let’s try those elements in the following equation:

difficulty of long distance relationship = (cost of trip/combined income) x number of hours travel x number of hours difference x number of days left x video chat

It’s a start. Let’s see what kinds of numbers it gives us, using about what Reanna and I have left to go–a little over a year: For Bill Gates, the index would range between about .01 to maybe 30, depending on the difficulty of the trip, or between .1 and 300, without video chat. For someone poor, with a long, difficult trip that costs their yearly salary and no video chat, the index would be about 600,000. If this very unfortunate couple had 10 years to go instead of a year, they get 6,000,000. I know, that doesn’t sound like much of a relationship, but I’m looking for the upper end of the scale.

Reanna and I get about a 30. Not too bad, I guess, though it goes up to 300 when I’m at Not Back to School Camp, which is way out on the information-dirt-road. So we get a range of 30-300, which is the same range as Bill Gates’ worst-case scenario–if he had to take his private Lear jet to the central Asian steppe every time he wanted to see Melinda.

OK, here’s where you can help me out, if you want. There are certainly several problems with this scale. Here are two, off the top of my head: First, the range of .01 to 6,000,000 is too big to think very clearly about. How hard is my 30 compared to Bill’s .01, or Mr. Unfortunate’s 6,000,000? Other than “somewhere inbetween,” it’s difficult to say. The equation needs some kind of transformation to produce easier numbers, say between 1 and 100. Second, some things aren’t working out with the math. As it is, if a couple is very poor, even a 10-day LDR with an easy trip comes out harder than Bill’s 10-year LDR with a very difficult trip, as long as Mr. Unfortunate doesn’t have Skype. That can’t be right. If any of you are math people, what do you think? Third, there are other factors that should be included but are difficult to operationalize, like communication skills and depth of commitment. Any ideas, conceptual people?